Why Colleges Should Stop Choosing Peers by Habit
Colleges often select peers through reputation, geography, association membership, or inherited practice. Principal component analysis offers a more disciplined alternative by identifying institutions that genuinely resemble one another across many dimensions at once.
I. The Problem with the Peer List
Every college has peers, or at least institutions it calls peers. Some names survive from earlier strategic plans. Others share a region, athletic conference, institutional classification, religious tradition, or professional association. Presidents and trustees may add institutions they admire. Admissions offices compare themselves with colleges competing for the same students, finance teams choose institutions with similar budgets, and faculty members may emphasize curriculum or academic reputation.
Each list may serve a legitimate purpose, but problems begin when institutions treat these groups as though they answer the same question. Competitors, comparators, collaborators, and aspirational institutions are not interchangeable. A nearby college may compete for applicants without resembling the institution financially or academically. A prestigious university may represent an ambition without providing a sensible benchmark for staffing, spending, retention, or tuition discounting. An association may unite institutions around shared values even when enrollment, resources, and academic programs differ sharply.
Traditional peer selection often begins with a name rather than a measurement. Someone proposes a familiar institution, then analysts gather evidence to justify the choice. Familiarity makes the comparison feel reasonable, but it can conceal weak analytical foundations. A poorly constructed peer group can distort every benchmark that follows. An institution may appear to spend too much because its comparison group contains colleges with fewer programs or less residential infrastructure. Graduation rates may look impressive until analysts account for differences in student preparation and selectivity. Faculty compensation may appear inadequate beside wealthy aspirational institutions but competitive among colleges with similar resources.
Peer selection shapes the story the data will tell. The problem becomes more serious when each office maintains its own list. Admissions may use one set of competitors, institutional research another, finance a third, and advancement a fourth. Leadership presentations then compare the institution against shifting reference points. One analysis reports strength, another reports weakness, and both may be numerically correct without offering a stable frame for decision making.
A better process begins by defining the question. Institutions should distinguish among colleges that resemble them operationally, colleges that compete for the same students, colleges that achieve stronger outcomes with similar resources, and colleges that represent a plausible future state. One list cannot answer all four questions equally well. Structural peers should share measurable characteristics. Competitive peers should reflect actual student choice. Performance peers should support meaningful comparisons of outcomes and efficiency. Aspirational peers should represent an attainable direction rather than a distant ideal.
A recent presentation by Dr. Hanin Alhaddad at UT San Antonio offered a useful example of how institutional research can strengthen the process. Alhaddad, an institutional research analyst at the university, demonstrated how Python and principal component analysis can move peer identification away from impression and toward reproducible evidence. UT San Antonio also recognized her with its 2026 Innovation Trailblazer Award, an appropriate distinction for work that applies analytical methods to a familiar institutional problem.
The lesson extends beyond one model or one institution. Colleges use peer groups to evaluate tuition, staffing, salaries, retention, graduation, fundraising, facilities, academic programs, and administrative costs. Weak peers produce weak comparisons. The traditional question asks which colleges seem similar. A stronger question asks which colleges occupy a similar position across the dimensions that define institutional structure.
II. Let the Data Find the Peers
Principal component analysis, usually called PCA, offers one way to answer that question. Colleges generate many potentially relevant measures, including enrollment, tuition, endowment, instructional spending, faculty size, program mix, admissions profile, student demographics, graduation rates, Pell enrollment, geographic draw, and residential intensity. Comparing institutions across every variable at once quickly becomes difficult, especially because several measures overlap. Enrollment relates to staffing and spending. Selectivity often relates to graduation. Endowment per student may connect with financial aid and instructional resources. Treating every measure as independent can give redundant information too much influence.
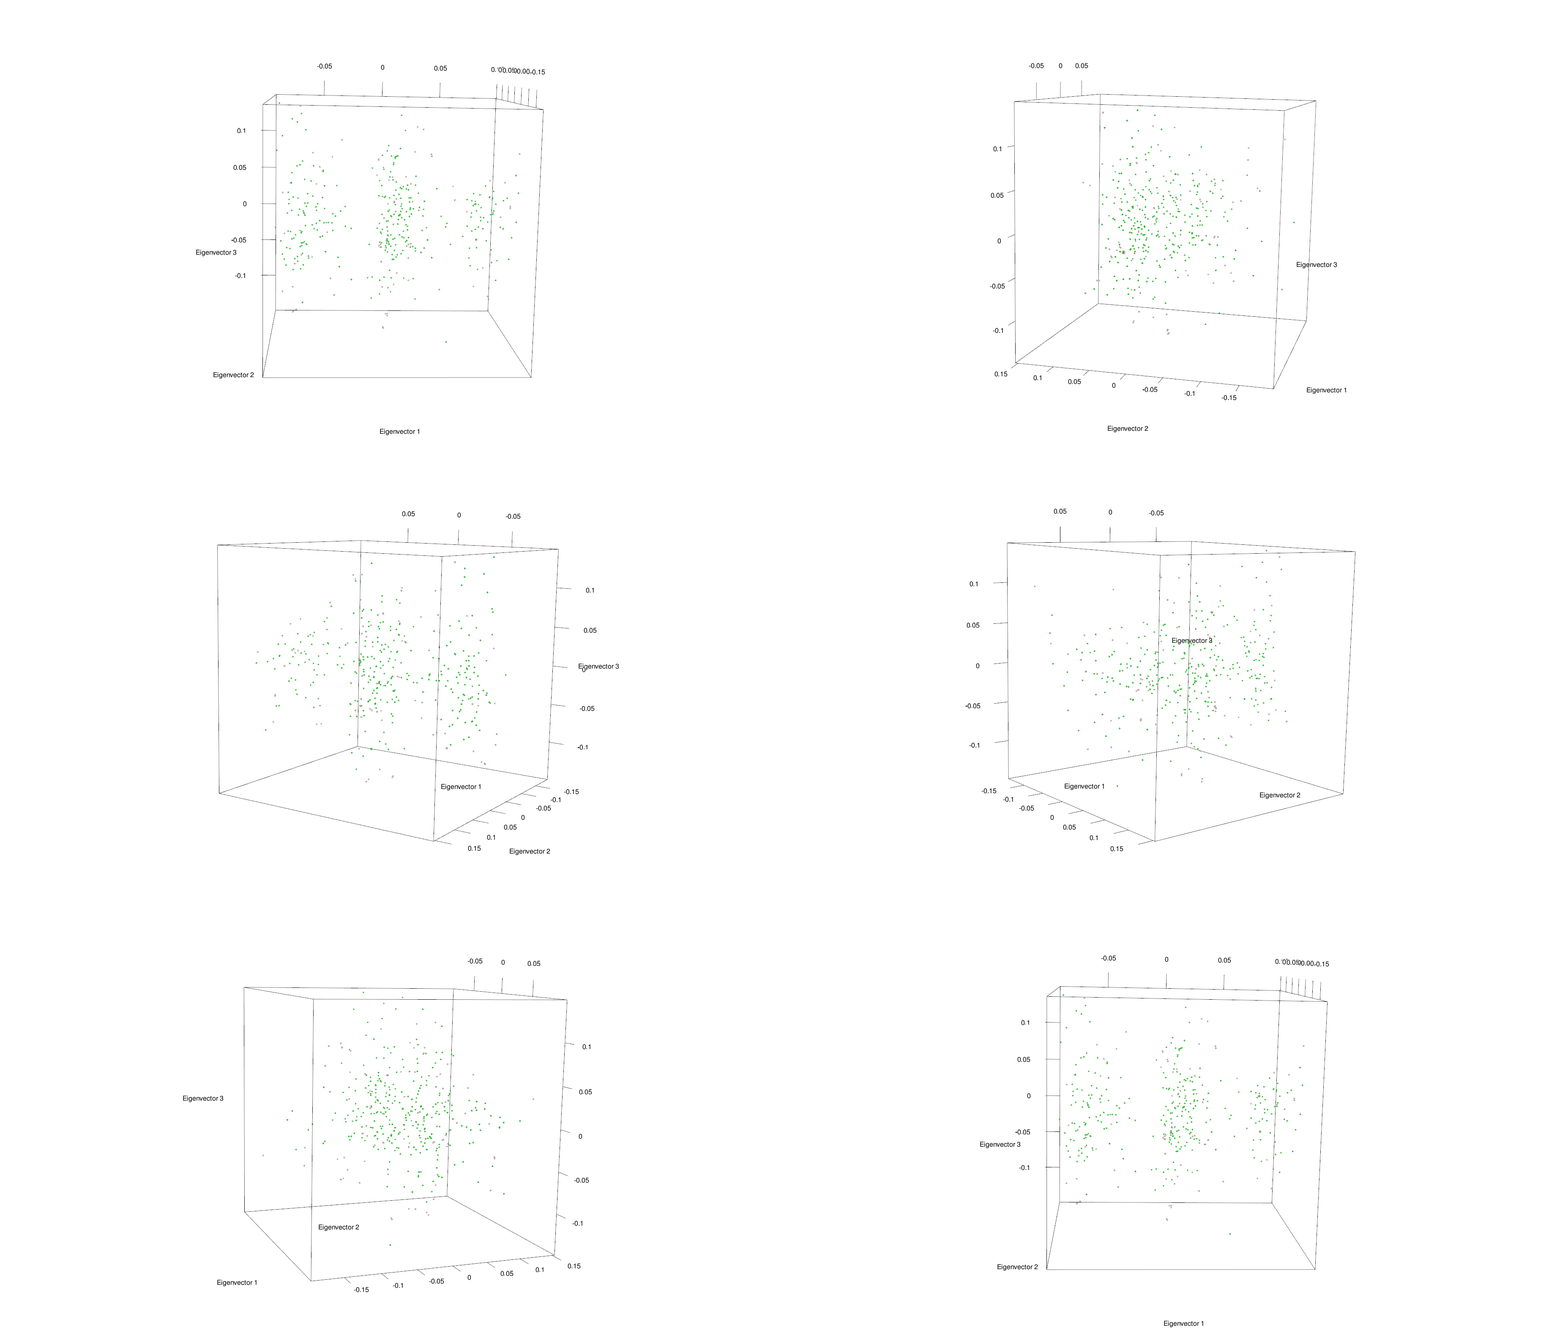
Animated principal component analysis showing how multidimensional data can separate into visible clusters after projection onto principal components. The example uses genetic data from settled Irish and Irish Traveller populations rather than higher education institutions, but it demonstrates the same dimensional reduction method described in this essay. Created by ETOH, 2014. Source: Wikimedia Commons. Licensed under Creative Commons Attribution 4.0 International, CC BY 4.0.
PCA reduces that complexity by identifying combinations of variables that explain the largest differences among institutions. Analysts can then represent much of the original variation through a smaller number of underlying dimensions. One component might reflect institutional scale through enrollment, staffing, and total expenditures. Another might capture resources through endowment, spending, and financial aid. A third could distinguish residential undergraduate institutions from commuter or graduate focused universities. A fourth might reflect selectivity and student outcomes.
The model does not name those components. Analysts interpret them by examining which variables contribute most strongly to each one. Mathematics identifies the pattern, and institutional knowledge gives the pattern meaning.
Analysts must standardize the data before running the model because enrollment, tuition, endowment, and graduation rates use different units and numerical ranges. Without standardization, variables with larger numbers could dominate the result simply because of how they are measured. After standardization, every institution receives a score on each principal component. Colleges with similar scores occupy nearby positions in the resulting mathematical space, allowing analysts to calculate distance and identify institutions that sit closest to the college under study.
A visual plot may reveal clusters that were invisible in the original spreadsheet. Some results will confirm conventional wisdom, but others may surprise. A college long treated as a peer may prove distant after analysts consider resources, size, student composition, and program mix together. An overlooked institution in another region may emerge as a close structural match. An aspirational institution may sit far away but reveal the dimensions along which change would need to occur.
Surprise forms part of the value because a method that merely reproduces the inherited list has accomplished little. PCA also forces institutions to confront variable selection. A model built mostly from admissions measures will identify admissions peers. A model dominated by finance will produce financial peers. A model that combines structural characteristics with outcomes may unintentionally confuse similarity with success.
A stronger design separates what an institution is from how well it performs. Size, program mix, student profile, geography, and financial capacity may define structural similarity. Retention, graduation, earnings, fundraising, and research productivity may measure performance. Analysts can first identify institutions operating under comparable conditions, then examine which ones achieve stronger outcomes. The sequence allows colleges to ask who operates under circumstances most like ours and who performs better under those circumstances.
Data quality still matters. Analysts may draw from IPEDS, College Scorecard, Carnegie classifications, financial statements, admissions records, or endowment surveys. Every source has limitations. Federal data provide broad coverage but simplify institutional complexity. Financial definitions may vary. Program classifications may obscure interdisciplinary curricula. Admissions measures may change meaning as testing policies evolve.
A responsible model should document every variable, year, source, transformation, and exclusion. Analysts should also test whether results remain stable when they use different years, remove highly correlated variables, or change the number of components. Reproducibility matters because peer selection often becomes political. Leaders should be able to understand why an institution appeared on the list and whether modest changes in assumptions would alter the result.
PCA can also work with cluster analysis. PCA reduces the number of dimensions, then clustering methods group institutions that occupy similar positions. Hierarchical clustering can show how small groups combine into larger institutional families, and other methods can test whether the apparent groupings remain stable.
No model should operate as a black box. Python does not eliminate judgment. Analysts still decide which institutions enter the candidate pool, which variables matter, how missing data are treated, and what distance qualifies as meaningful. Code makes those decisions reproducible, not automatically correct.
Institutional judgment remains necessary after the model produces its candidates. A mathematically close college may have a specialized mission, governance structure, or regional role that limits its usefulness as a comparator. Another may be undergoing a merger or rapid transformation that historical data have not yet captured. Leaders should not reject an unfamiliar result merely because it feels wrong. They should ask why the model placed the institution nearby.
The strongest peer framework combines three forms of evidence. Quantitative similarity identifies institutions with comparable structures. Student choice data reveal actual market competition. Institutional judgment adds mission, strategy, and context that public datasets cannot capture. A modern institution may therefore need several clearly labeled groups rather than one official list.
Structural peers resemble the institution across measurable operating characteristics.
Competitive peers overlap in applications, admissions, or student choice.
Performance peers achieve stronger outcomes with similar resources.
Aspirational peers represent a plausible strategic destination.
Some colleges may appear in more than one group, but the categories should remain distinct. Peer analysis can then become more than an annual benchmarking exercise. Component scores can show whether scale, resources, selectivity, program breadth, or student composition most strongly separates one institution from another. Changes over time can reveal whether strategic decisions are moving the institution toward or away from a chosen group.
The model becomes a map. A map does not decide where an institution should go. It shows where the institution stands, what lies nearby, and how far it must travel to reach a chosen destination.
Dr. Hanin Alhaddad’s work at UT San Antonio deserves acknowledgment because it represents institutional research at its best. The analysis applies a reproducible method to a familiar administrative practice and improves the quality of the questions leaders can ask.
Colleges may still choose the institutions they admire, and they may continue to maintain competitors, collaborators, and aspirational models. They should label those relationships honestly. Aspirations tell an institution what it hopes to become. Evidence tells it who its peers really are.
Further Reading
- UT San Antonio Institutional Research and Analysis
- UT San Antonio 2026 University Excellence Awards
- National Center for Education Statistics, IPEDS